The U.S. States Offering the Most Support to Veterans
Every Year, U.S. Veterans Receive Billions of Dollars in Benefits, But Some States Pay Out Far More Than Others. Here’s Why
As of 2024, there were 16.2 million veterans in the U.S., with 1.1 million veterans 100% disabled due to service injuries and afflictions. In 2023, the Department of Veterans Affairs (VA) spent $301 billion on veteran benefits, around five percent of all federal spending.
This study will consider how and where those benefits are spent to find out which states spend the most on veteran support, and which lag. And we’ll see why there’s such a nationwide VA benefits differential.
VA Benefit Distribution Across The U.S.
Broadly speaking, of the annual $301 billion VA spends, the biggest state populations get the biggest amounts. Of the following ten states that received the highest total amount of VA benefits in 2024, nine feature in the list of top ten U.S. states (based on population).
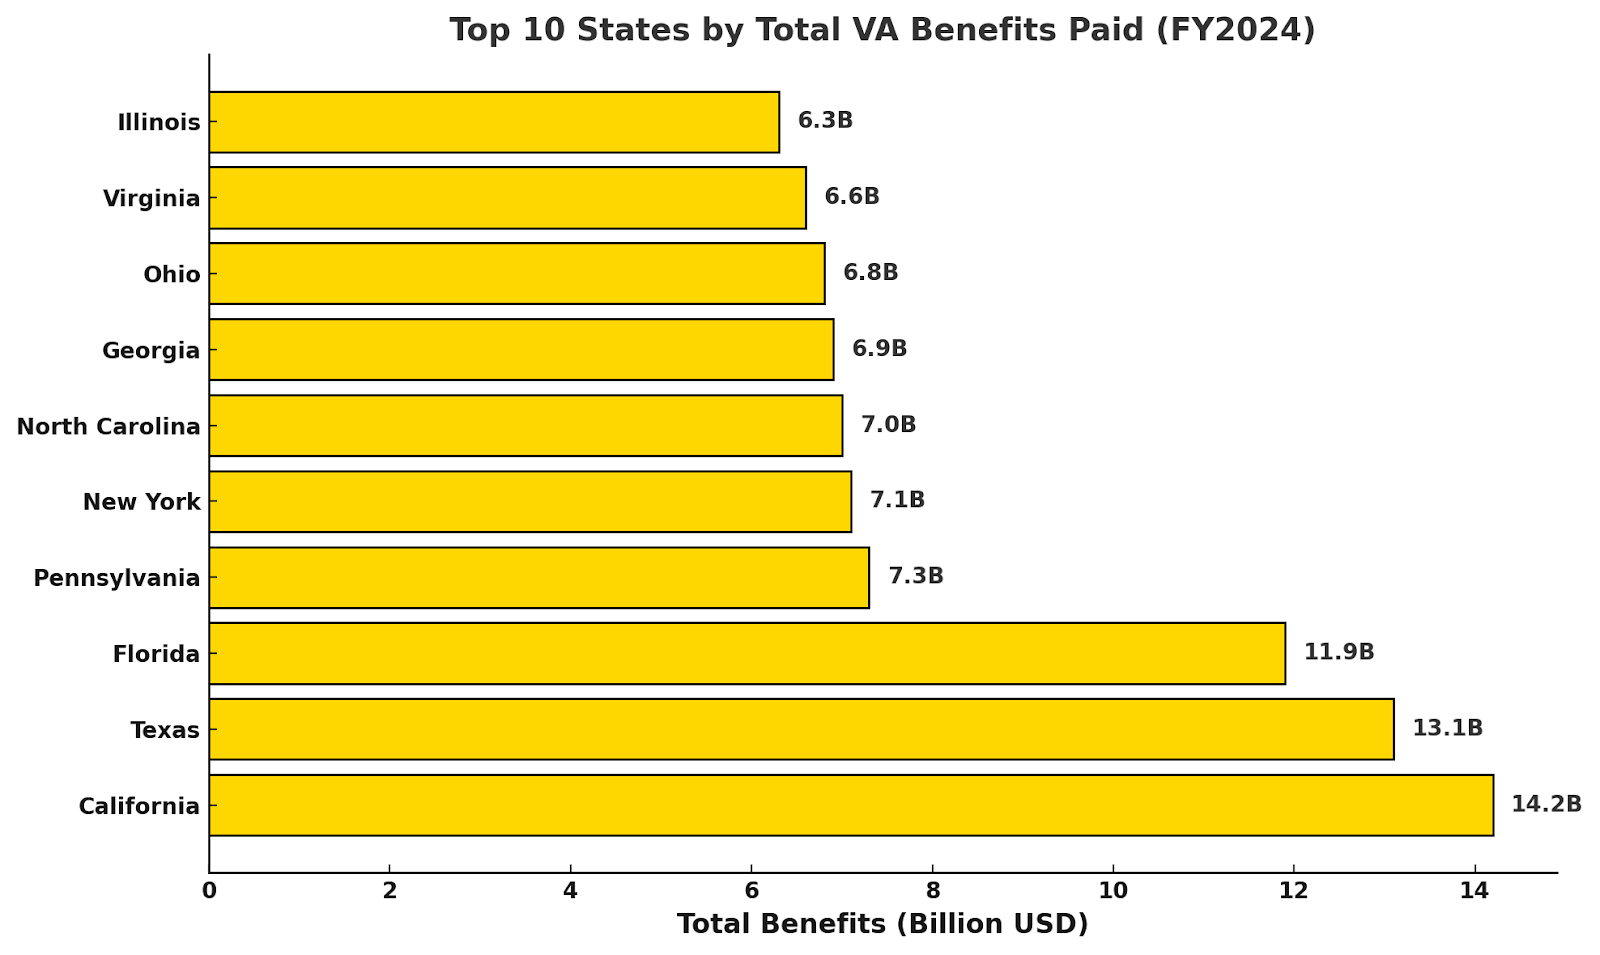
Yet those figures don’t necessarily correspond to veteran benefit parity. Study data tells us that each state features its own very specific veteran population, and in each case, the VA benefit profile and concomitant determining factors are different.
A good example of this is a quick look at the states paying the highest average benefits to U.S. veterans. We can immediately see that none of the following five states are among the top ten states paying the overall highest sums.
| State | Avg Benefits Per Veteran |
|---|---|
| West Virginia | $12,070 |
| Maine | $11,943 |
| Arkansas | $11,708 |
| Kentucky | $11,481 |
| Mississippi | $11,289 |
| National Average | ~$9,800 |
It’s worth considering why these states feature the highest average benefit payments, as that in part explains why VA payments in the U.S. are so varied.
In the case of West Virginia, the state is home to an above-average number of veterans (8%, with the national average around 6%). West Virginia’s veterans also feature a high percentage who now carry a disability due to their service (35.2%, with the national average currently at 30%), which means they’re eligible for higher payments. And West Virginia also has the highest number of adults who suffer from at least one chronic condition in the U.S. Combined, these factors push the state to the top of the highest average benefits list.
In Maine’s case, a lot of the same factors apply. For example, the veteran population is significantly above the 6% national average (9%). But there are also additional VA benefits that impact the overall average payments, such as VA-linked property tax exemptions and home loan guarantees.
Study data confirms that similar consistent factors also apply to Arkansas, Kentucky, and Mississippi, such as a higher-than-average veteran population (8%, 7.2%, and 6.5%, respectively) plus significant tax exemptions for disabled veterans.
In terms of the top five states paying the highest average benefits to veterans, only Maine also features among the top five states with the highest veteran population percentages.
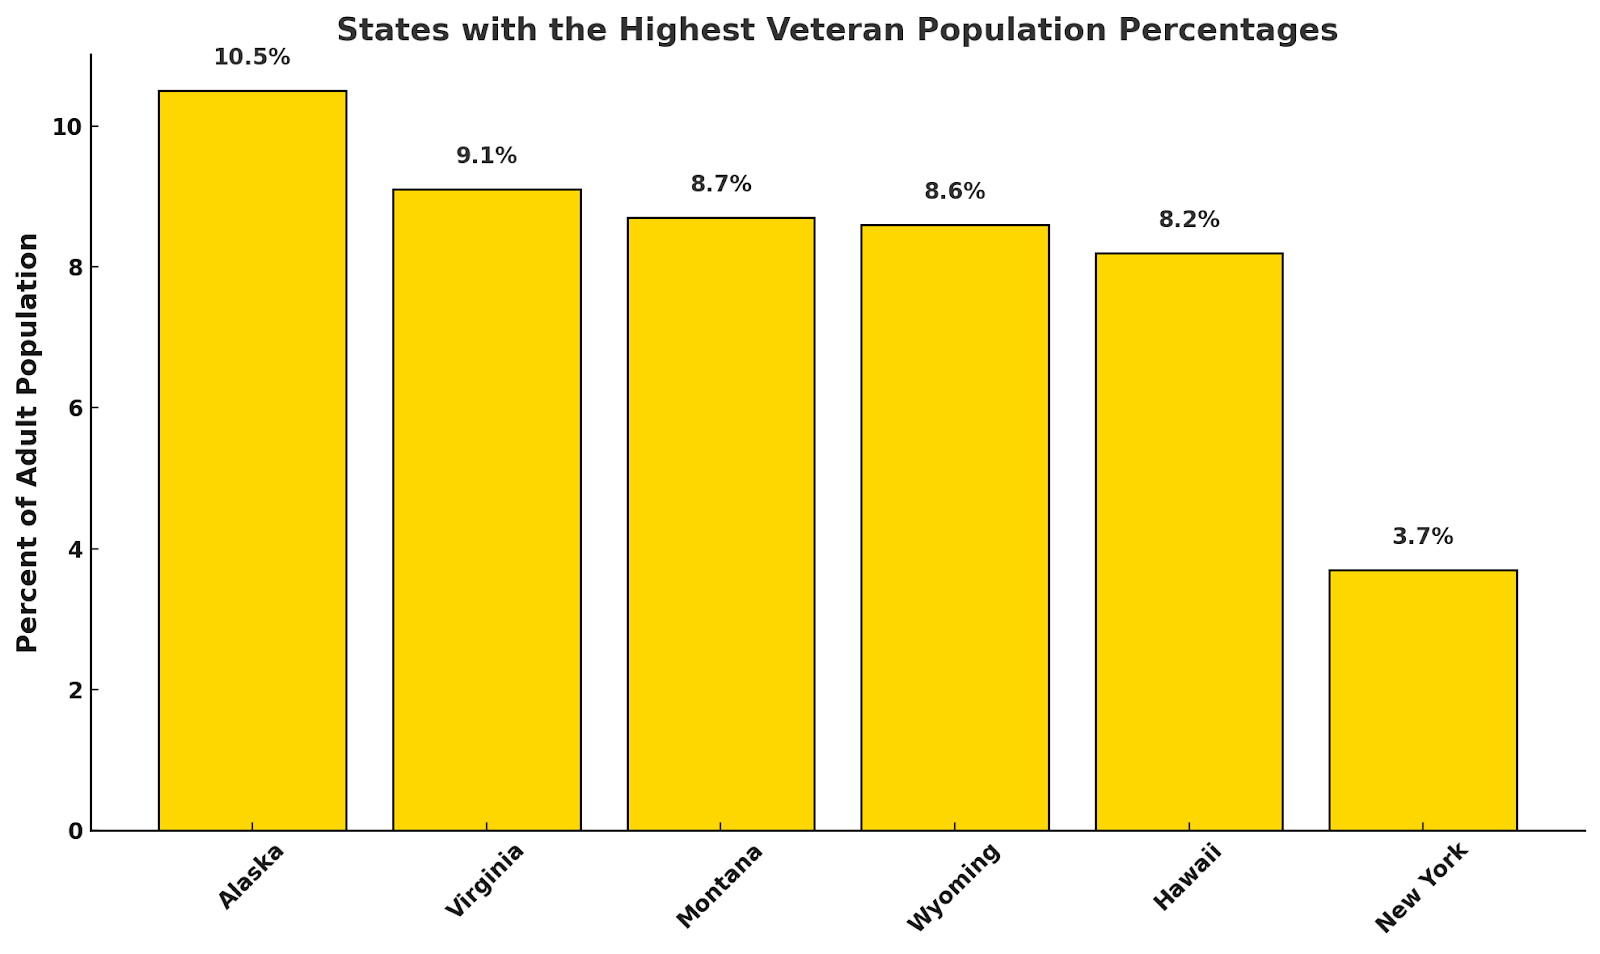
| State | % of Adult Population That Are Veterans |
|---|---|
| Alaska | 10.5% |
| Virginia | 9.1% |
| Maine | 9% |
| Montana | 8.6% |
| Wyoming | 8.5% |
Interestingly, New York, which features on the top ten list of VA payment amounts by state, has a particularly low veteran population percentage of 3.7%, with only Washington, DC (3.2%) featuring a lower percentage.
This can in part be attributed to the fact that a higher-than-average percentage (37%) of New York veterans are disabled (with the average at 30%). Additionally, New York has a huge population (the fourth biggest in the country, just under 20 million people), which is also on the rise – the state added 129,881 residents between 2023 and 2024.
Veteran Demographics By State and Region
Of 16.2 million veterans in 2024, 89.9% were male, with just 10.1% female. The states with the highest percentage of female veterans were Hawaii (11.1%) and Oregon (11%).
The average veteran age range percentages in 2024 looked like this:
- 65+ years: 50.5%
- 45–64 years: 33.7%
- 18–44 years: 15.8%
Florida has one of the oldest veteran populations. Of 1.43 million veterans, 719,000 (just under 50%) are aged 65 or older, making it one of the states with the oldest veteran cohorts. At the other end of the age spectrum, Texas, home to approximately 1.52 million veterans, features many post‑9/11 veterans who represent a younger, more diverse group.
About 43% are between the ages of 35 and 54, with 23% between the ages of 55 and 64. Just 16% of Texan veterans are 65 or older. Veteran age spreads are key factors when it comes to VA spending, as older veterans are usually eligible for additional medical and caregiving benefits.
State Veteran Benefit Fluctuations
As state populations constantly evolve, each state’s veteran population is also subject to change. And the circumstances of a percentage of a state’s veteran residents may also change. This means that state veteran benefits can fall as well as rise.
It’s worth considering some examples of sharply rising state veteran benefits and the reasons for the rise.
| State | 2022 VA Benefits | 2024 VA Benefits | % Change |
|---|---|---|---|
| Texas | $12.2B | $13.1B | +7.4% |
| Florida | $11.2B | $11.9B | +6.3% |
| California | $13.6B | $14.2B | +4.4% |
Texas, Florida, and California were all subject to significant VA benefit payment increases between 2022 and 2024, and in all three cases, similar factors contributed to the rises.
The three states represent the country’s top three veteran populations, and the Cost of Living Adjustment (COLA) ensures that veteran benefits don’t fall below the levels needed to cover the cost of the things veterans need. The Social Security Administration (SSA) finalizes the annual COLA adjustment, which is then applied to VA benefits such as disability compensation, dependency and indemnity compensation, and survivors’ benefits.
When COLA is applied to such vast veteran numbers, a significant total benefit figure rise is inevitable. For example, in Texas, there was an 8.7% increase in 2022 and a 5.9% increase in 2023.
Also, the Sergeant First Class Heath Robinson Honoring our Promise to Address Comprehensive Toxics Act of 2022 (PACT) means that qualifying veterans now receive expanded healthcare and benefits coverage, particularly veterans who have been exposed to Agent Orange and other toxic elements.
| State | 2022 VA Benefits | 2024 VA Benefits | % Change |
|---|---|---|---|
| Illinois | $6.4B | $6.2B | -3.1% |
| New York | $7.3B | $7.0B | -4.1% |
Conversely, some states saw a significant fall in veteran payment benefits, especially Illinois and New York. In the case of both states, budget shortfalls were to blame, with things like PACT, which is meant to increase veterans’ payments, catching both states off guard when it came to budgetary constraints, and leading to congressional intervention.
It’s also true that some states are not giving their veterans what’s owed for a variety of reasons, mainly because veterans are often not sure which benefits they can claim, which suggests that the states in question need to offer more relevant help.
State Veteran Payment Disparities Now and in the Future
Ultimately, while Texas, Florida, and California pay the most veteran benefits each year, they’re also home to the highest number of veterans. But none features the highest average veteran benefit payment (all three states are outside the top five average benefit payment states).
This shows that veteran benefit payment levels always depend on very specific criteria in each case and that every state has its unique veteran community, with its own very specific needs and benefit rights.
The types and amounts of benefits veterans receive are usually based on service history, disability status, age, and other associated individual circumstances. So, measuring where America supports its veterans most is complicated.
For those states that appear to be lagging, it may in part represent a failure to calibrate the amounts veterans are owed with overall budgetary spending: in the future, further governmental intervention to make up any shortfall is distinctly possible. And yet it’s also a fact that U.S. spending on veterans across states is sometimes uneven.
This may even be the case when we factor in different veteran population types. Some veterans may not get what they’re due because they’re not fully aware of all the benefits they’re entitled to.
This might be because they haven’t been given sufficient information, or because of educational issues; it may also be down to problems completing the application process. In such cases, veterans need better support.
Ultimately, as state populations naturally evolve over the coming years, and things like the PACT Act strengthen many veteran claims, the bigger veteran payment picture will continue to change.
But it’s crucial, whatever the complexion of each state, that veterans are given the right amount of support to honor their invaluable service to our great country.
If you feel you’re not getting the benefits you’re due, get in touch with the dedicated team at CCK today for help.