State-by-State Look at Veteran Support and Spending
In our study, State–by–State Look at Veteran Support and Spending, we examine how states fund and deliver veteran benefits, highlighting spending, usage, and disparities across all 50 states. Our analysis reveals where systems succeed, where they fall short, and how these differences impact both individuals and communities.
Our goal is to increase transparency in resource distribution and identify critical gaps in care. This study is designed to inform policy decisions, spark meaningful dialogue, and promote more equitable and effective support for veterans nationwide.
State Spending Disparities: Unpacking Unequal Distribution of Veteran Benefits
Variations in veteran benefit spending can reflect both the size of a state’s veteran population and local budget priorities. Our analysis indicates that some states channel far more funds than others, creating substantial disparities in how veterans receive care and assistance.
Top 10 states by total expenditure (in USD):
- Texas: $27.7 billion
- California: $25.2 billion
- Florida: $22.6 billion
- North Carolina: $ 12.1 billion
- Georgia: $10.9 billion
- Virginia: $9.9 billion
- Ohio: $8.5 billion
- Pennsylvania: $8.2 billion
- New York: $8.2 billion
- Illinois: $8 billion
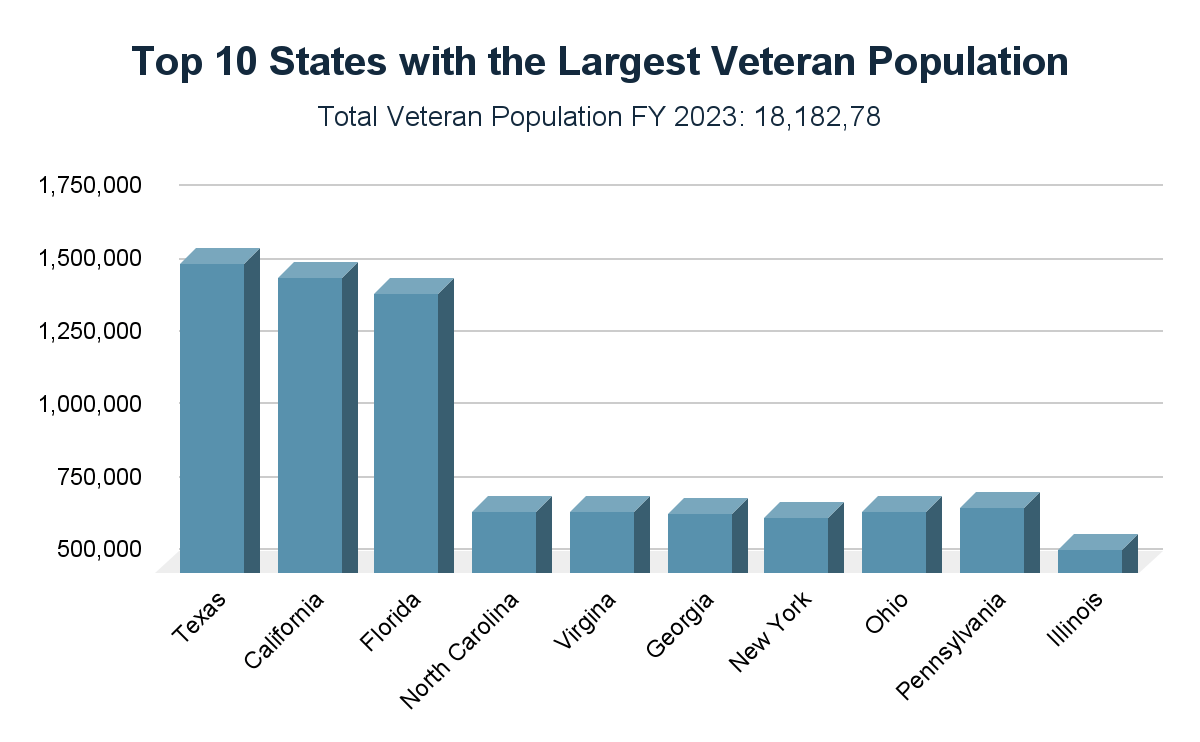
States like Texas, California, and Florida naturally lead in total expenditures because they host large veteran populations. Our findings in a recent review of data from the Department of Veterans Affairs (VA) indicate that the national total veteran population, as of 2023, stands at 18,182,789. This highlights the importance of examining how closely spending aligns with local needs.
Medical Care Insights: The Largest Expenditure Area
Access to healthcare remains a cornerstone of veteran support, as many former service members face unique medical challenges post-discharge. Our research confirms that the biggest chunk of funding often goes toward medical care.
- Nationwide medical care expenditure: $109 billion
- Percent of total spending (medical care): 38.3%
The VA statistics we analyzed also indicate that approximately 6,243,677 unique patients are served nationwide. Texas alone accounts for 567,360 of those patients, translating into a total medical care expenditure of $9.2 billion in that state. This highlights the scale of need and the substantial resources required to deliver comprehensive healthcare services.
Per Veteran Spending Efficiency
Looking at raw totals is vital, but evaluating spending on a per-veteran basis helps us understand how effectively states utilize their budgets. According to the figures we studied, Washington, D.C., leads in per-veteran expenditures.
Top 10 states by average spending per veteran:
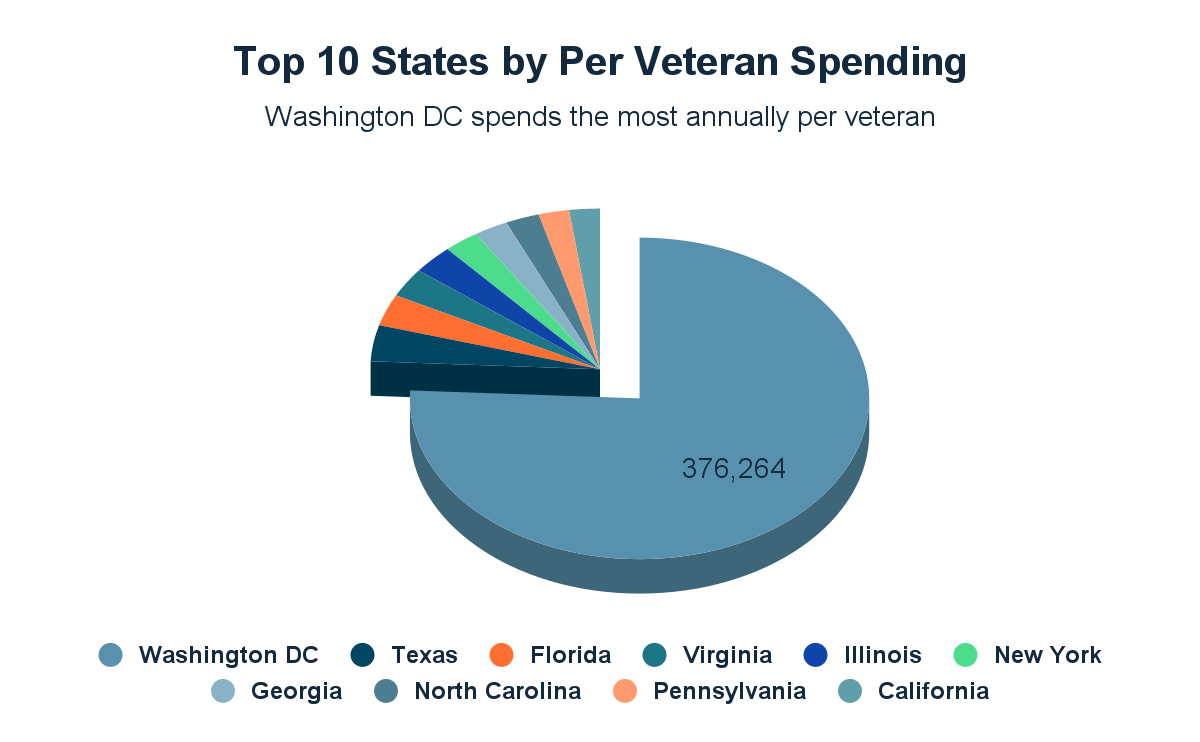
- District of Columbia: $376,264
- Texas: $18,033
- Florida: $15,786
- Virginia: $14,540
- Illinois: $14,398
- New York: $12,293
- Georgia: $11,892
- North Carolina: $11,815
- Pennsylvania: $10,722
- California: $10,714
The District of Columbia’s noticeably high per-veteran figure reflects specialized administrative costs and programs. General Operating Expenses alone total $8.7 billion there, emphasizing how local structures may require significant funding to manage and deliver benefits in a sensible way.
Veteran Population Trends: Connecting Numbers to Funding
Our analysis confirms a strong correlation between veteran population size and total expenditure. Large populations naturally demand greater resources, but that does not always mean proportionate spending or equitable outcomes.
States with fewer veterans may exhibit higher per-veteran costs, pointing to potential inefficiencies or specialized requirements.
- Total VA expenditure nationwide: $284.7 billion
Breakdown of sending categories:
- Compensation and pension: $145.6 billion (51%)
- Medical care: $109 billion (38.3%)
- Education and vocational rehabilitation/employment: $12.4 billion (4.3%)
We found that education and vocational programs, though smaller in total allocation, remain a key factor in helping veterans reintegrate into civilian life. This balance between high-demand medical care and crucial supportive programs reveals the complexity of veteran benefits administration.
Policy Implications: Paving the Way for Equity
A central objective of our study is to illuminate how funds might be restructured to better serve veterans across every demographic. Unequal spending often stems from gaps in administrative planning, regional priorities, and the sheer complexity of veteran needs.
Key insights and recommendations:
- Resource allocation per veteran: States with smaller veteran populations, like the District of Columbia, can spend significantly more per individual, which may hint at both specialized services and inefficiencies.
- Medical care dominance: Medical care accounts for 38.3% of total spending, reflecting the high demand for healthcare solutions and the importance of investing in robust medical networks.
- Targeted education and vocational support: Although they represent just 4.3% of total spending, these programs offer vital paths for employment and long-term stability. Strengthening these areas could reduce overall reliance on medical and pension expenditures.
- Administrative costs: High overhead expenses in places like Washington, D.C., spotlight the potential for streamlining processes to ensure more funds directly benefit veterans.
- Disability compensation utilization: Our analysis of VA data highlights that 62.8% of veterans rely on disability compensation, a benefit critical to supporting daily living and long-term care.
When states tailor policies and budgets to meet actual veteran needs, the result is a more equitable system. By emphasizing transparent data reporting, we can encourage lawmakers and stakeholders to target funding gaps and prioritize essential services.
Utilization Patterns: Healthcare and Disability Compensation
According to VA statistics we reviewed, healthcare remains the most commonly accessed benefit at 95.7% utilization. Notably, usage rates among women (45%) and men (50.7%) are fairly close, signaling a near-universal need for medical services across all demographics.
Disability compensation is the second most commonly accessed benefit, with 62.8% utilization, underscoring the substantial portion of veterans who rely on financial support due to service-connected conditions.
Within this group, 32.4% are women, and 30.4% are men, demonstrating that the need for disability compensation spans all backgrounds and service experiences.
Moving Forward
Our analysis reveals key disparities in how states allocate veteran benefits. By comparing per-veteran spending and highlighting gaps in medical care and efficiency, we show where systems succeed—and where they fall short.
We urge policymakers and advocates to use this data to push for fairer, more effective support. A veterans disability lawyer can be an essential ally for those struggling to access the benefits they’ve earned.